What Is Clash Royale?
Clash Royale is a popular RTS top down mobile game. The game has cards for each troop which can deployed onto the battlefield strategically to defeat the enemies castle like towers. There are currently around 120 cards in the game, each card has a rarity determining stats and ease to upgrade, and elixir cost to deploy the troop, along with its stats. Rarity can vary between, common, rare, epic, ledgendary, and champion, each one increasingly rare. Different types of chests can be won from battling, giving cards to the played onces opened. Collected cards are placed into decks of 8 which can be deployed in a battle. Our enitre project followed this theme, and we created features like a deck builder, a tornament tracker, a custom survay, and a deck information page.
My Feature
My primary feature displays data collected at official clash royale tournaments in a user interactive format. The user can see the top decks in the current meta and sort through them based off of data such as popularity, name, and win percentage. This feature provides valuable insight into deck building, as a precursor for experienced and new players alike to Dante’s and Ashwin’s features. I had a second feature in the works for a while that was never finished, it worked in tandem with my teammate Gershawn’s feature pulling data from the official clash royale database. The purpose was to retrieve clan and player information and displaying it for the user to search through, I spent many hours before and during break, attempting to get the data to pull and display but with much troubleshooting and attempts to reach out to my peers for assistance my second feature ultimately fell through. In addition to my feature, I put in extensive effort in to my groups team teach, and frontend design, I helped construct the frontend visuals and layout of the site.
Collections
| Requirements | My Feature |
|---|---|
| From VSCode using SQLite3 Editor, show your unique collection/table in database, display rows and columns in the table of the SQLite database. | This database contains the data for each users collection of cards, which is my feature. Decks from this database are filled into the table. 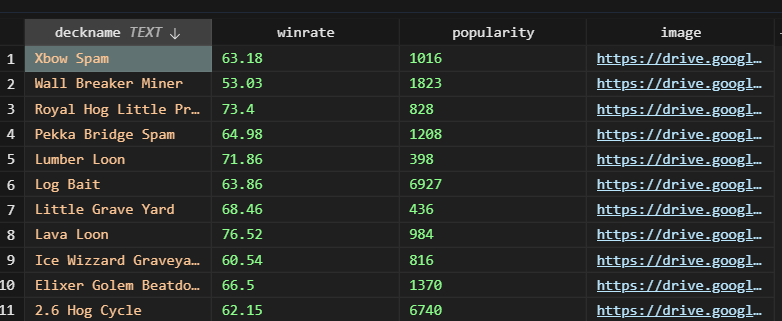 |
| From VSCode model, show your unique code that was created to initialize table and create test data. | This is the code initializing the table in my model file. 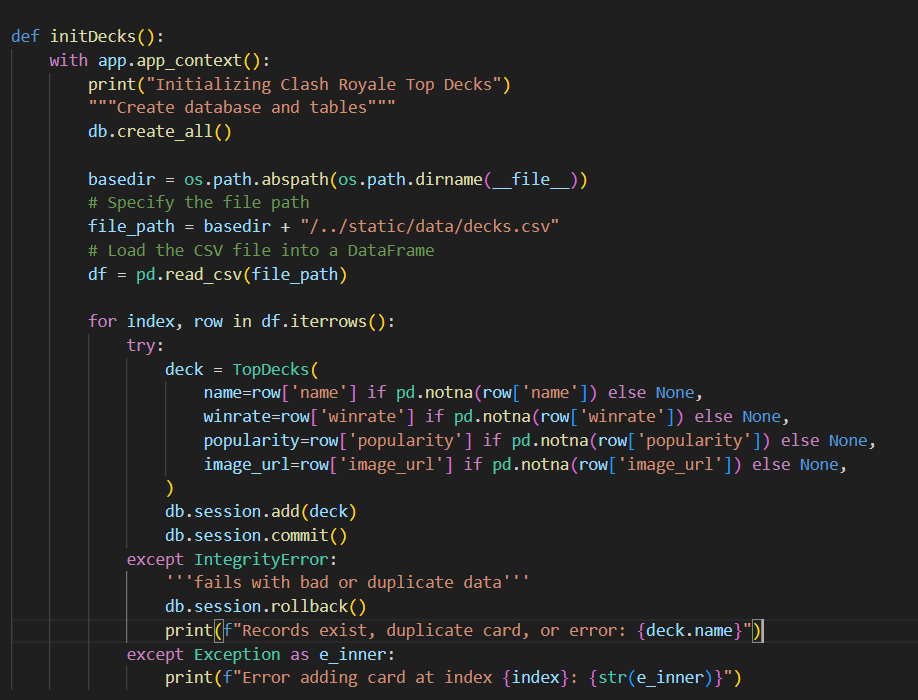 |
Lists and Dictionaries
| Requirements | My Feature |
|---|---|
| In VSCode using Debugger, show a list as extracted from database as Python objects. Extracted in VScode. | 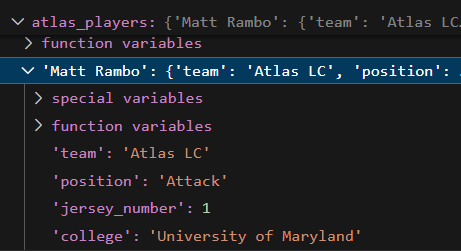 ” ” |
| In VSCode use Debugger and list, show two distinct example examples of dictionaries, show Keys/Values using debugger. Proof of DB. | 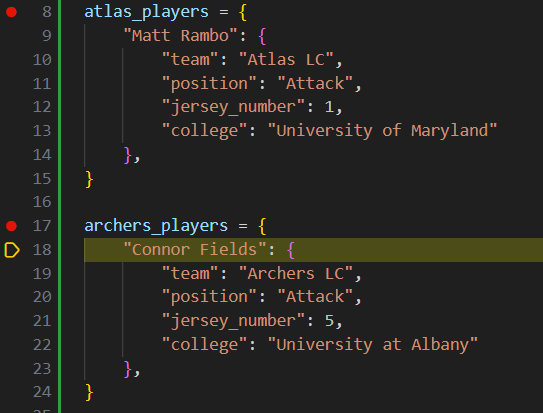 |
APIs and JSON
| Requirements | My Feature |
|---|---|
| In VSCode, show Python API code definition for request and response using GET, POST, UPDATE methods. Discuss algorithmic condition used to direct request to appropriate Python method based on request method. | This is my API endpoint code that uses a GET method to obtain the data from my backend. The class defines another resource for retrieving a user’s collection of Clash Royale cards from the database. It also includes tje Class that is called when a user opens a legendary chest. It creates 4 cards with raritys epic or higher. 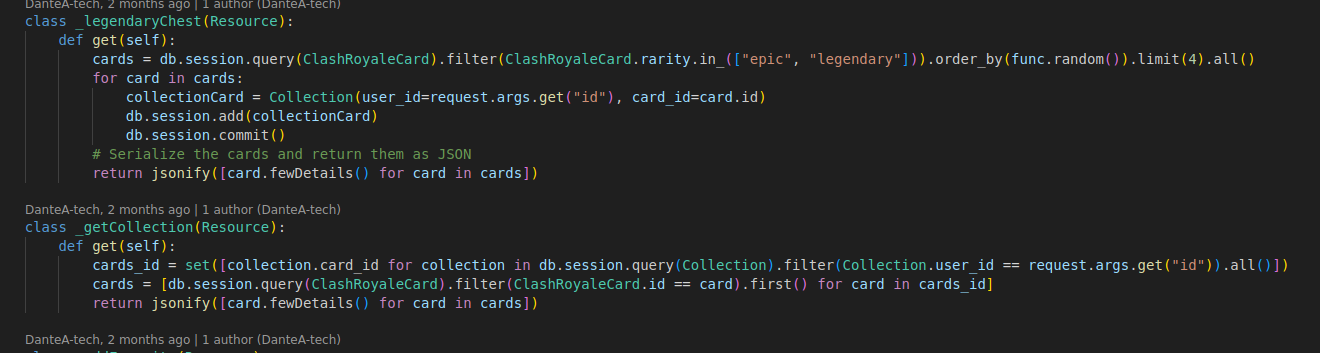 |
| In VSCode, show algorithmic conditions used to validate data on a POST condition. | This is my API endpoint code for my machine learning project. It recives the team IDs imputed by the user in the frontend, and validates it by checking if the value is null or is the value is not an integer. If that is the case it returns a bad request error. If the team IDs are valid, it imputs them into the prediction model to get the win rate. 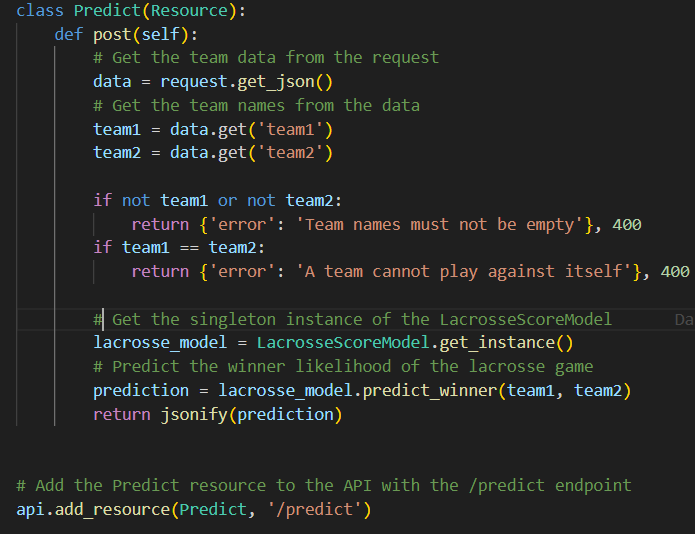 |
| In Postman, show URL request and Body requirements for GET, POST, and UPDATE methods and show the JSON response data for 200 success conditions on GET, POST, and UPDATE methods. This image shows a frontend inspect with the GET of the backend data. | 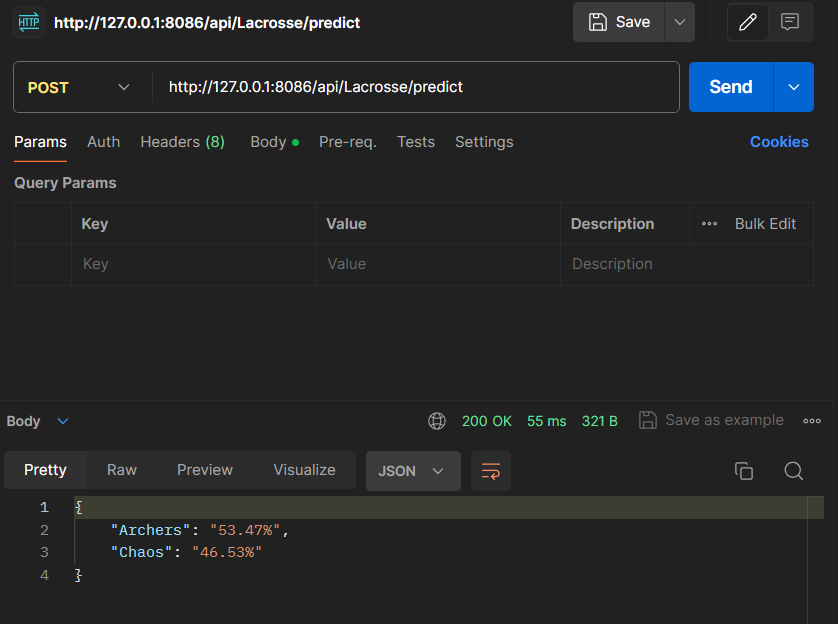 |
| In Postman, show the JSON response for error for 400 when missing body on a POST request. | 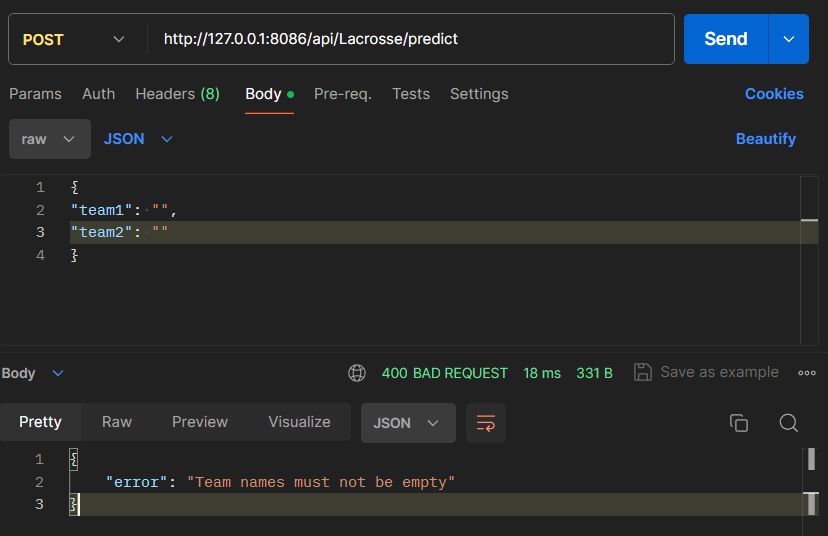 |
| In Postman, show the JSON response for error for 404 when providing an unknown user ID to a UPDATE request. | 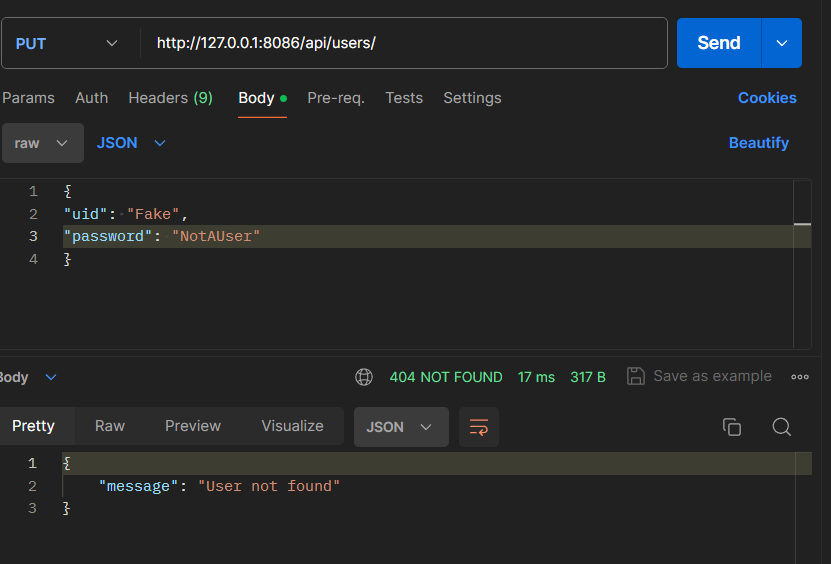 |
Frontend
| Requirements | My Feature |
|---|---|
| In Chrome inspect, show response of JSON objects from fetch of GET, POST, and UPDATE methods and show a demo (GET) of obtaining an Array of JSON objects that are formatted into the browsers screen.. | 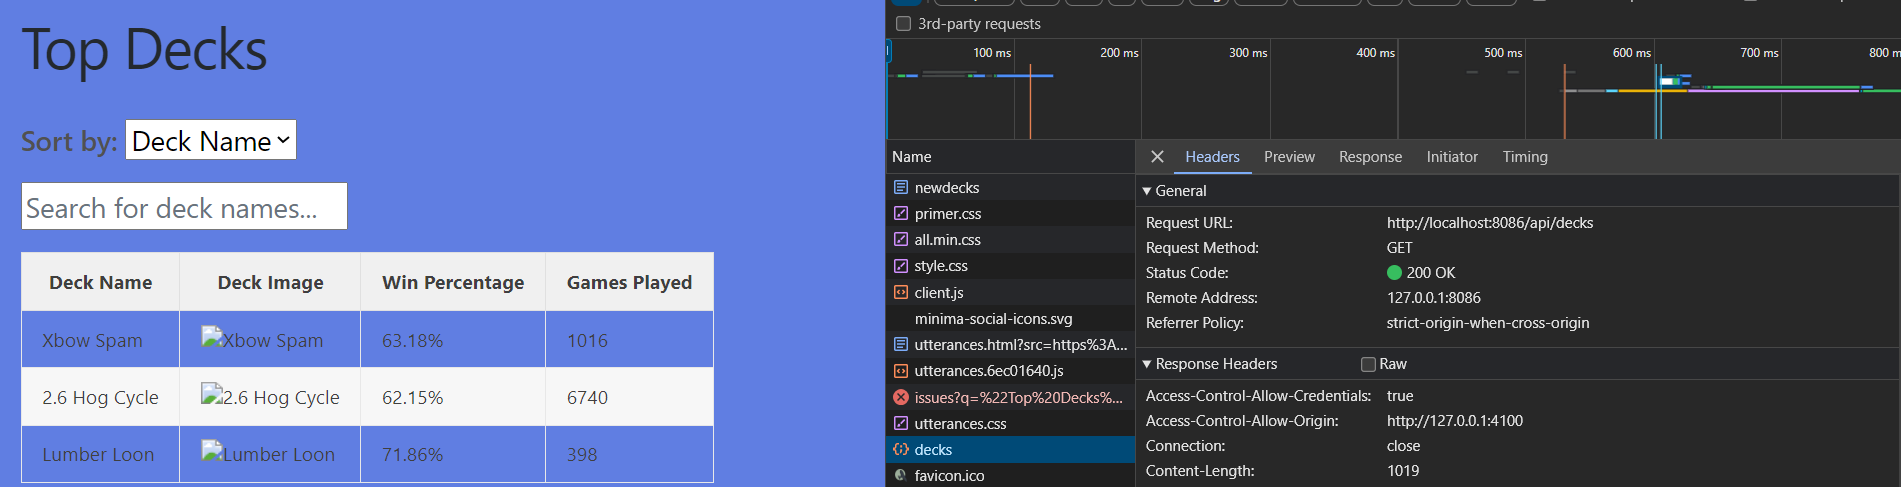 |
| In JavaScript code, describe fetch and method that obtained the Array of JSON objects. | This fetches the variable API endpoint and populates the table with the data. 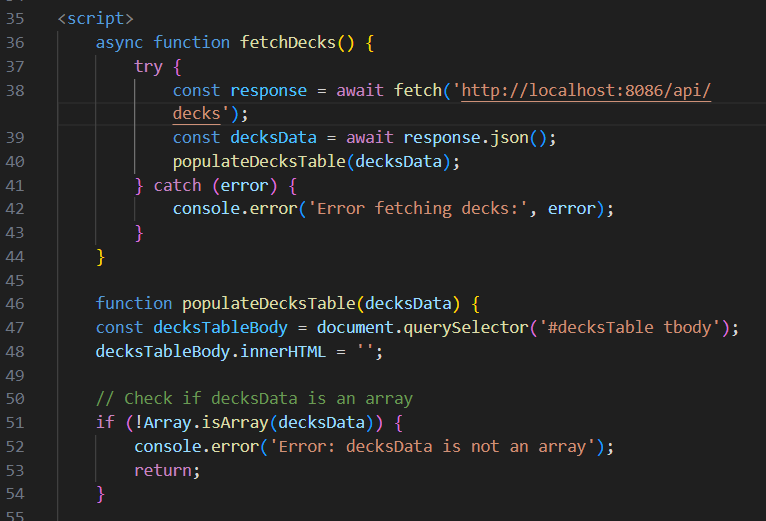 |
| In JavaScript code, show code that performs iteration and formatting of data into HTML. | This iterates through the card data from the backend, and creates the container in HTML so it can be displayed with the card image icons.  |
| In the Chrome browser, show a demo (POST or UPDATE) gathering and sending input and receiving a response that show update. Repeat this demo showing both success and failure. | Demo user database post/update with frontend and/or postman, because screenshotting in networks is not possible due to redirect. Using login system because it was a primary project of mine. |
| In JavaScript code, show and describe code that handles success. Describe how code shows success to the user in the Chrome Browser screen. | This code runs the cards from the fetch data into a display fards function that appends the cards to their containers, created in the styling. 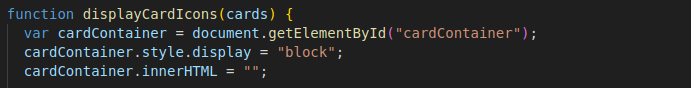 |
| In JavaScript code, show and describe code that handles failure. Describe how the code shows failure to the user in the Chrome Browser screen. | This checks the data fetched from the backend. If the data array of devks is empty it returns an error message with the data recived into the console. This is very helpful while debugging to see what data is being sent from the backend easily. In the browser screen it displays a simple error for the user.  |
Extras
-
Show algorithms and preparation of data for analysis. This includes cleaning, encoding, and one-hot encoding.

-
Show algorithms and preparation for predictions. (Below Code Cell)
    def _train(self):
        X = self.lacrosse_data[self.features]
        y = self.lacrosse_data[self.target]
        # Splitting the data for training and testing
        X_train, X_test, y_train, y_test = train_test_split(X, y, test_size=0.2, random_state=42)
        self.model = LinearRegression()
        self.model.fit(X_train, y_train)
        self.dt = DecisionTreeRegressor()
        self.dt.fit(X_train, y_train)

    @classmethod
    def get_instance(cls):
        if cls._instance is None:
            cls._instance = cls()
        return cls._instance

    def _load_data(self):
        self.lacrosse_data = pd.read_csv('lacrosse.csv')
        self.lacrosse_data['wins'] = (self.lacrosse_data['score_differential'] > 0).astype(int)  # Assuming win based on positive score differential

    def predict_winner(self, team1, team2):
        team1_data = self.lacrosse_data[self.lacrosse_data['team'] == team1]
        team2_data = self.lacrosse_data[self.lacrosse_data['team'] == team2]

        team1_score = self.calculate_composite_score(team1_data)
        team2_score = self.calculate_composite_score(team2_data)

        total_score = team1_score + team2_score
        team1_chance = (team1_score / total_score) * 100
        team2_chance = (team2_score / total_score) * 100

        return {
            team1: f"{team1_chance:.2f}%",
            team2: f"{team2_chance:.2f}%"
        }

    def calculate_composite_score(self, team_data):
        # Calculate composite score based on various factors
        composite_score = team_data['score_differential'].mean() + \
                          team_data['two_point_goals'].mean() + \
                          team_data['assists'].mean() + \
                          team_data['shots'].mean() + \
                          team_data['shots_on_goal'].mean() + \
                          team_data['saves'].mean() + \
                          team_data['caused_turnovers'].mean() + \
                          team_data['groundballs'].mean() + \
                          team_data['faceoff_pecentage'].mean() + \
                          team_data['power_play_goals'].mean() - \
                          team_data['turnovers'].mean() - \
                          team_data['scores_against'].mean() - \
                          team_data['x2_point_goals_allowed'].mean() - \
                          team_data['penalties'].mean() - \
                          team_data['penalty_minutes'].mean() - \
                          team_data['power_play_pecentage'].mean() - \
                          team_data['penalty_kill_pecentage'].mean()

        return composite_score

# Composite score for each team based on score differential, goals, assists, shots, saves, turnovers, scores against, penalties, etc.
# Deducts certain factors such as turnovers, scores against, penalties, etc., as they are expected to negatively impact performance.
# Considers a broader range of factors compared to just averaging the data resulting in a more accurate prediction.
- Discuss concepts and understanding of Linear Regression algorithms.
Linear Regression is a statistical technique for understanding the relationship between variables, assuming a linear connection and aiming to find the best-fit line through data points by adjusting slope and intercept.
- Discuss concepts and understanding of Decision Tree analysis algorithms.
Decision Trees are tree-like structures used in machine learning to make decisions based on input features, with nodes representing questions/tests, branches showing possible outcomes, and leaf nodes indicating final decisions. They are versatile for tasks like classification and regression, capable of handling complex data relationships.
Additional Discussion:
A composite score is calculated for each team, factoring in metrics like score differential, goals, assists, shots, saves, turnovers, scores against, penalties, and more. This holistic approach provides a comprehensive overview of team performance. Negative performance indicators are deducted from the composite score, reflecting their expected adverse effects on team performance. This method goes beyond simple averaging by considering a wider array of factors, resulting in a more precise prediction of team performance.